The Mad Science of Conversion Rate Optimization

In this article you will learn
— The basics of correlation and causation
— The trinity model
— Local maximum testing
— Multivariate testing
Conversion rate optimization (CRO)…that elusive formula to get visitors to do what you want once they arrive to your site, whether it be to fill out a registration form, get a quote, or make a purchase.
Despite easily being the most important element in a web marketing campaign, this subject has received a startling lack of attention, with most blogging heads opting to talk about the more accessible topics of SEO, social media marketing, video marketing and others.
Perhaps people are scared off because CRO actually requires some background in math, stats, and even (gasp!) science.
The goal: The goal of CRO is to establish a positive correlation between a certain feature of your site and the desired action you want users to take, normally expressed as X and Y. In some cases the correlation is very simple to establish: Let’s say you own an online bakery. On Tuesday you feature your new seasonal product– hand-rolled oatmeal cookies with craisins for $9.95 a box.
For your CRO test, you labeled the cookies as “site feature x.” The desired outcome (y) is for 10% of all visitors to buy a box. After the first two weeks, you notice not too many people are buying, so you lower the price to $5.95 a box and get your desired conversion rate of 10%; a simple CRO test successfully completed!
It gets complex when you start to consider the dozens of site features which can raise or lower your conversion rate, including colors, images, number of pages, taglines, trust signals, value proposition and others.
But before we get into that, let’s have a little refresher on the basics of correlation and causation. If you feel that you grasp correlation and causation perfectly, please feel free to move past this section and get right to the good stuff.
Correlation and Causation
What is a Correlation? The measurement of the relationship between the two variables you will test.
Ok, then what’s a Variable? It can be almost anything on your site: The products you sell, an offer for a free consultation, the color of the landing page, the text you choose to use, the images you include, accreditations, social media, trust signals, mobile compatibility…and much more.
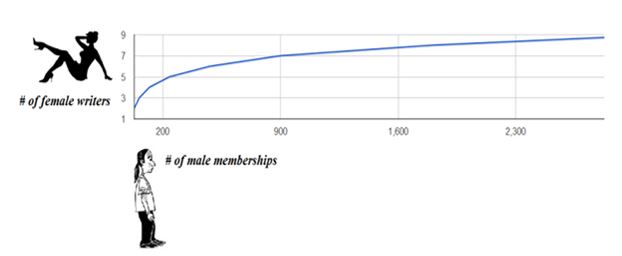
What is a Positive Correlation? An increase in X = increase in Y Quite simple. Below is a pretty predictable positive correlation for an erotic literature site we manage. In this project, “conversion” is defined as “number of registered members.”
Positive Correlation: An erotic literature site (click to expand image)
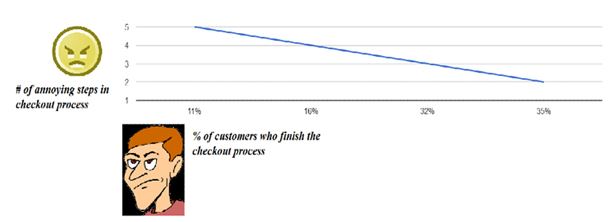
What is a Negative Correlation? Increase in X= decrease in Y. Here is a sample negative correlation we often see on ecommerce sites…one we wish more people would pay attention to.
Negative Correlation: Number of check-out steps for an ecommerce site
Correlation Coefficient: This is the strength of the correlation, also expressed as (r). For the erotic literature site example we gave, you can see the correlation is relatively strong for 1-7 writers, and relatively weak once we got up to 8 and 9 writers.
The reason for this was that we had a site layout that only allowed us to feature 7 writers per page (we had a large block on top for the most recent/featured writer and six smaller blocks below).
So once we added that 7th writer, a user had to go to the next page to see them. Subsequently, it stopped having a strong effect on registrations because most users never bothered to click to the next page to check if we had anymore writers.
Once we learned that, we stopped investing in writers and started investing in other strategies to increase membership. Very important information indeed!
If the correlation coefficient is positive, the correlation is expressed as a range from 0.1-1. If negative, the correlation is expressed from 0 to -1. Here is a positive correlation for a restaurant finder app we built for a magazine in Los Angeles.
Positive Correlation of r=0.85: A restaurant-finder app for iPhone

Here the correlation is somewhat less than perfect but still positive overall. The more restaurants listed in the app, the more restaurants people view but there are a lot of exceptions to this rule, as the relationship varies from person to person. Correlation does not imply causation. It’s obvious that the number of restaurants listed is not CAUSING users to view them. There are other reasons for that (mainly, they’re hungry and want a restaurant.)
Now we have to figure out why the people below the line aren’t viewing as many restaurants. Is it that they have found their favorite one already? Do they not like the app? Have they found a different/better way of locating restaurants? Have they left the geographic area?
All of these extraneous variables are called Z factors, which we are currently in the process of testing for our client. We will keep you posted as soon as we figure it out ourselves!
KPIs
Now that we are on the same page RE correlation and causation, the next step is to identify the key performance indicators (KPIs) for your website. KPI is really just business longhand for measuring how close you are to your goals. A good way to conceptualize this is the Trinity Model.
Trinity Model
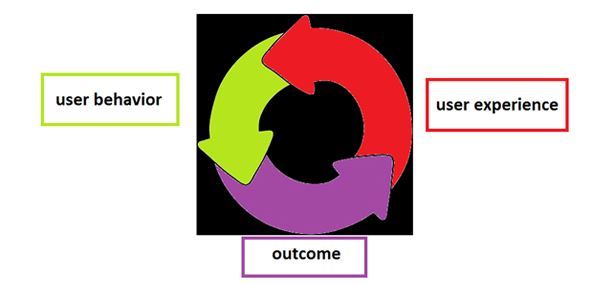
The trinity model is a useful container for information that most of us intuitively know. The site should start with user experience in mind and nothing else. Don’t think about what is best for you, but what is best for the user. That will create your first body of user behavior data, which will correlate to your ROI (return on investment).
Local Maximum
The local maximum is the absolute best user experience you can achieve by testing “local” changes, i.e. small changes. Local changes could include changing the color of the site, changing the text, improving the images, improving the button; anything that can be done in a relatively short amount of time and at little cost.
We recommend testing a total overhaul rather than local changes in hopes of hitting the big maximum. In other words, test large not small. There is not much point in testing small since it might perfect something that is not that great anyway. Testing two vastly different variables will make a bigger difference in conversion and provide more valuable data.
Multivariate Testing
Most CRO tests are multivariate since there are a number of factors and interactions to take into account. In some cases, there are A/B tests, which test only 2 factors. Occasionally, we choose to test multiple factors with sequences of A/B tests or A/B/n tests but these usually do a poor of job of capturing the interactions which really interest us.
Each test is composed of factors and conditions. Let’s take the site below as an example.
A Multivariate Test: The Gilroy Patch Online Newspaper

Here, there are 3 factors with 2 possible combinations in each case. This gives us a total of 8 groups. If you test all of these groups, you have just performed a full factorial, multivariate test. This requires you to make 8 versions of the site and beta test each separately.
That is complex enough as is but if you introduce even more factors, than your groups get larger. At that point you would use a fractional factorial test. This involves using only a small amount of the total groups for the experiment. You will do enough combinations to calculate the impact on users across all possible combinations.
You start with a small seed group and then calculate factor combinations. And then run the new, combined groups against each other.
Taking the example above, you would test in this way
A + (BC); B+(CA); C+(BA)
You only test factor A three times while holding B and C constant. Factor B is tested with A and C constant and factor C is tested with A and B constant. Then, you save the data and make adjustments accordingly.